Top 5 Key Performance Indicators for Ecommerce
Jared Law
July 13, 2018

Key Performance Indicators or KPI for short are the metrics that are used to see how well or poorly your site is performing. They not only give you an idea of what is performing well or not, but can give you specific insights into where you might need some improvement.
Top 5 KPIs
- Ecommerce Conversion Rate
Higher = Better - Average Order Value
Higher = Better - Add to Cart Actions
Higher = Better - Cart Abandonment
Lower = Better - Check-Out Abandonment
Lower = Better
But wait there’s more…
- Bonus Key Performance Indicator – Ad Spend vs. Revenue
Lower / Higher = Better ( right? )
1. Ecommerce Conversion Rate
The higher the percentage the better.
This is a really good starting point for our key performance indicators ( KPI ) monitoring, as it provides a good picture of how your site might be doing from an acquisition of a customer to a sale. You can quickly find this information within Google Analytics – Conversions > Ecommerce > Overview.
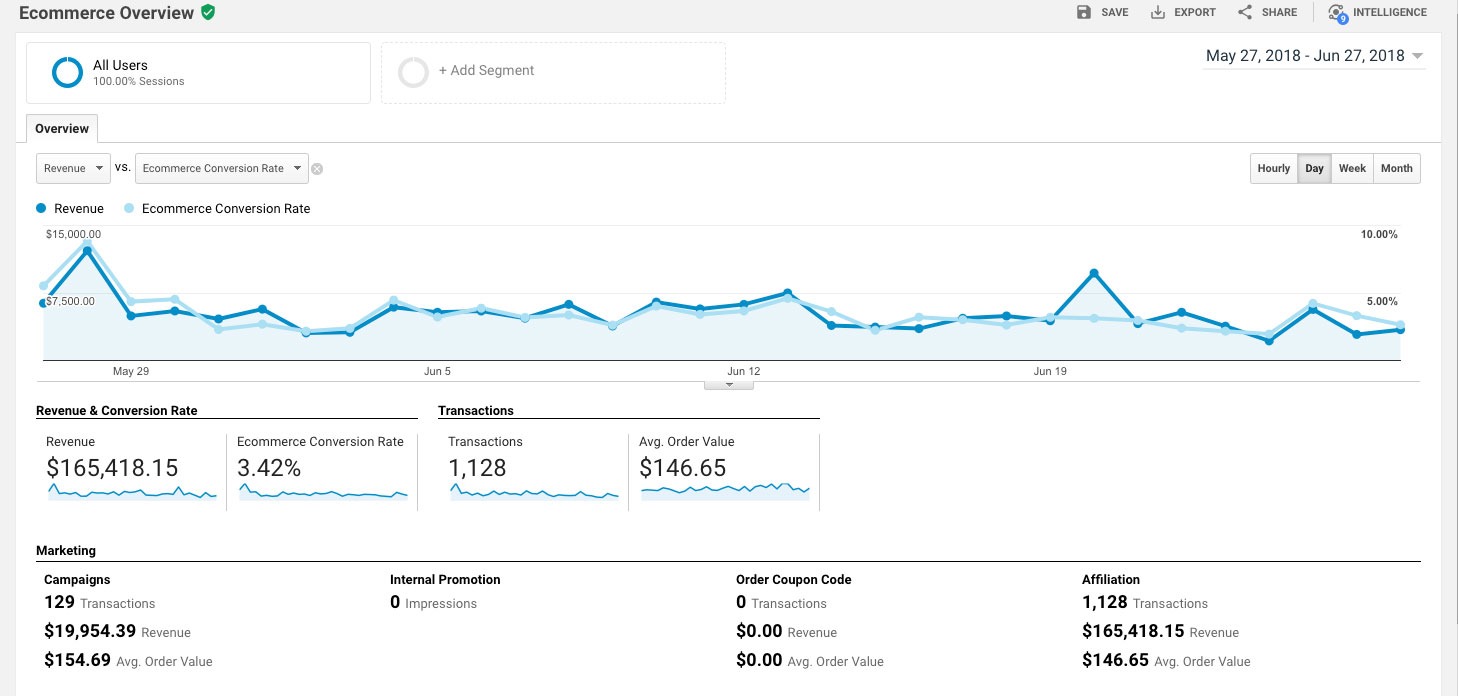
As noted earlier, the higher the conversion rate the better. If you have a high percentage conversion rate then you are likely killing it in several areas. If you have a lower percentage conversion rate then you may need to determine why that is so you can make improvements.
Primary factors impacting your conversion rate are:
- User Experience
Are you guiding your customers to the product, cart, and checkout? The easier the shopping and buying experience, the higher your conversion rate will be. - Ease of Purchase
When a user decides to buy, you’ll want to make it as easy as possible for them to do so. If they struggle with payment options, shipping, too many upsells, or at-checkout promotions you can make that user abandon their cart pretty quickly. - Average Cost of Products
While there are always exceptions, the higher your average product cost the lower your conversion rate. This is simply due to the fact that higher sticker price usually comes with more research and consideration. While you may convert someone eventually, it may not be within the tracked session(s) time frame. - Type of Product
Products that would fit into the instant gratification typically convert better than products that require time and research before buying.
2. Average Order Value
The higher the average order the better (most of the time).
It may seem silly or “duh” to mention this as one of the key performance indicators, but the higher your average order the better, with a few exceptions which we will get to in a bit. Beyond the “duh” of more money is better, this KPI can tell you a few things depending on what promotions and product changes you have going on in your store. Just like conversion rate, you can quickly find this information within Google Analytics – Conversions > Ecommerce > Overview.
What a high average order value might tell you:
- People are purchasing more expensive items
- Typically speaking, higher cost items will have a higher per unit net revenue, allowing for a higher potential net profit per order
- Your upsells are improving sales
- If your average order value goes up after adding or adjusting upsell opportunities within your check out flow, then this is a good indication that they are working
- Your shipping and or order amount deals may be working
- Running promotions for free shipping on orders of $50 or more or a spend $25 and get $5 off are often great ways to increase Average Order Value
When is a higher average order value not better?
A higher average order value is not better if you have an increase in average order value but a decrease in the number of transactions combined with a decrease in overall revenue.
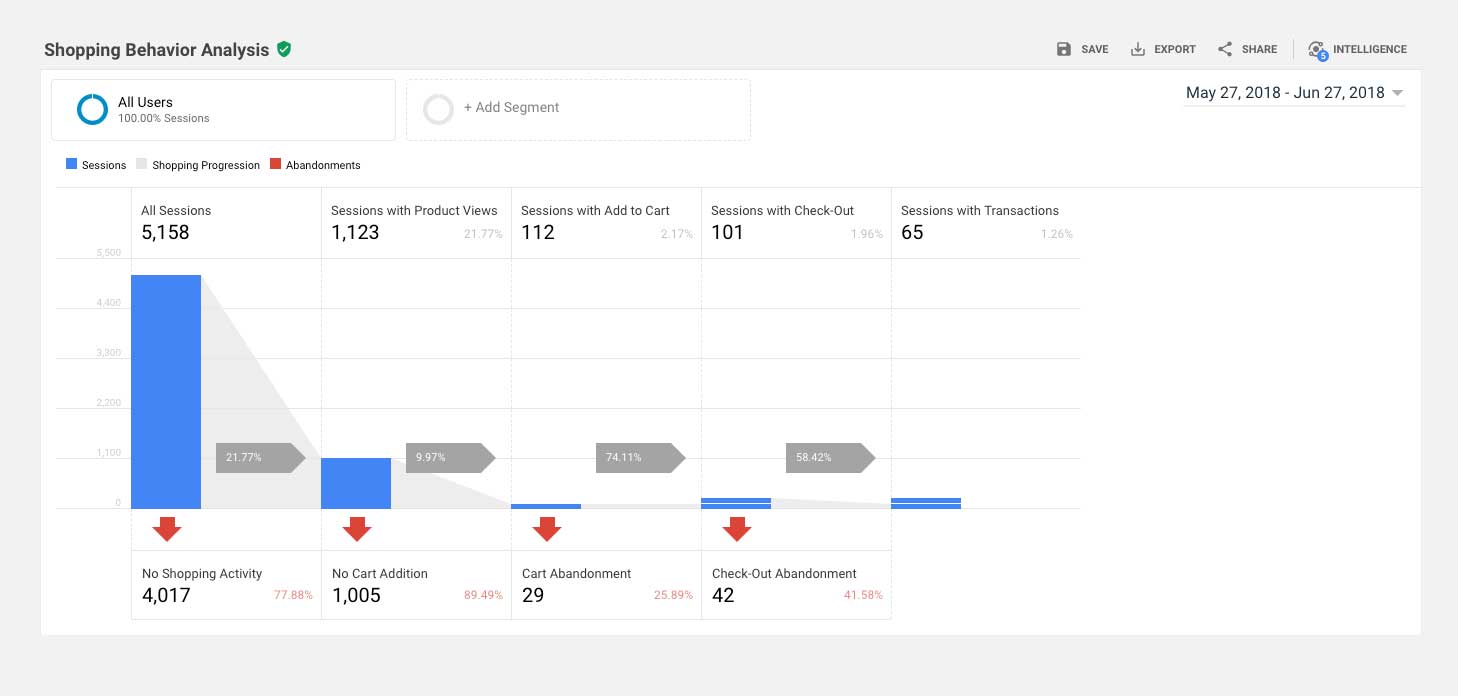
3. Add to Cart Actions
The more add to cart actions the better.
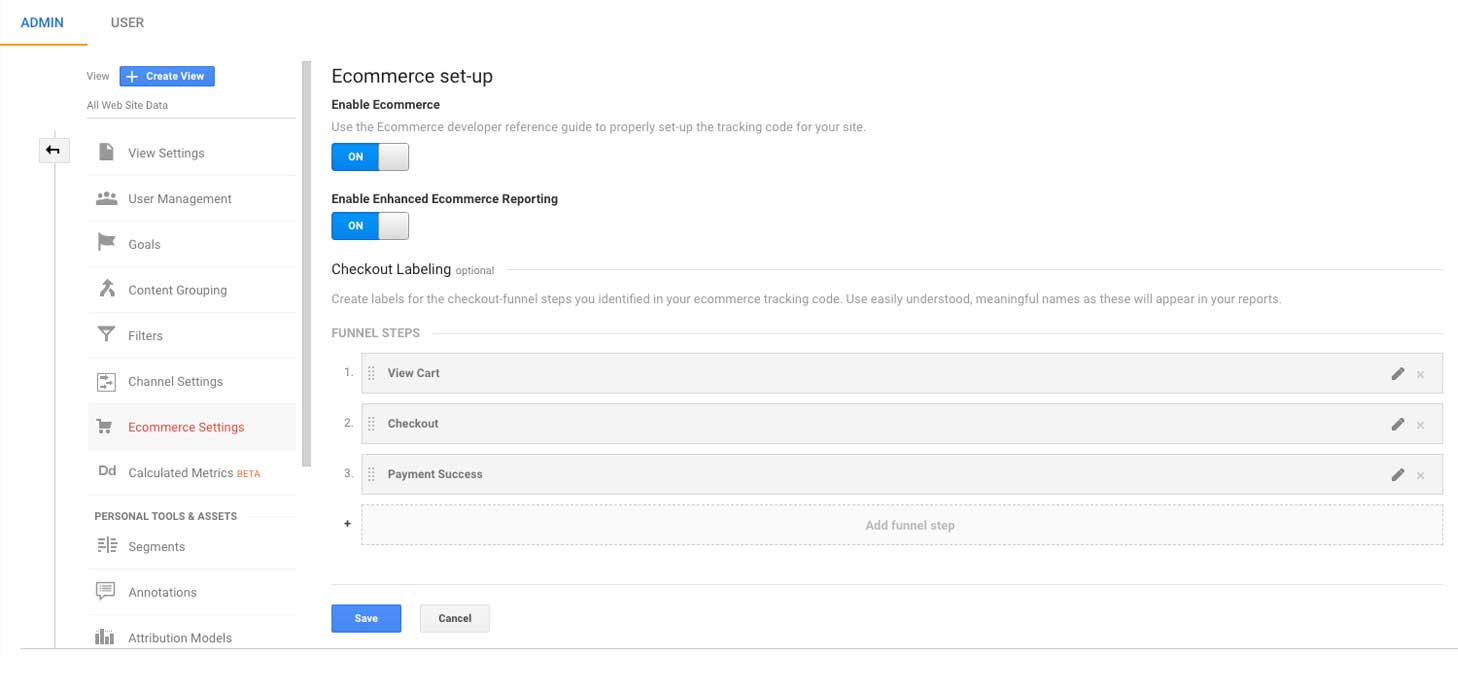
Generally speaking the more times you can get customers to add things into their cart the more likely they are to convert to a sale. If you are seeing change either up or down in revenue you can refer to this metric to understand how active shoppers might be engaging with your site once there. To view the add to cart actions you will need Enhanced Shopping Behavior enabled in your Google Analytics platform. This is available in Admin > View > Ecommerce Settings.
Once enabled you can see the add to cart actions and other details in the Conversions > Ecommerce > Shopping Behavior section of your Google Analytics platform.
Your add to cart actions can be impacted by:
- User Experience
Making it easy for a customer to add a product to your cart is a great way to positively impact your add to cart actions. - Complex Products or Configurable Bundle Promotions
Product customization or bundling is a great way to increase your average order value. Just be careful to not make it overly complicated, as that can negatively impact your add to cart actions. - Add to Cart to Compare
This approach is debatable within the e-commerce world, but it is true that providing an add to cart to compare feature will result in more cart actions. Just make sure to watch cart abandonment rate to determine its overall success.
4. Cart Abandonment
The lower the abandoned cart percentage the better.
As noted before, you want as many sessions with an add to cart action as possible. When a customer adds a product to the cart but fails to checkout, this creates an abandoned cart situation. Think of it as people loading up their shopping cart and then leaving it in the middle of an aisle. Obviously, the fewer times people leave your store with products unpaid for in the cart, the better your overall revenue will be. You can find this information in the same area as the add to cart actions, Conversions > Ecommerce > Shopping Behavior.
Action that you can do to reduce the cart abandonment:
- User Experience
Make sure a customer can quickly get to their shopping cart through intuitive navigation. Let them know how many items are in their cart and provide quick overviews of what they are without actually visiting the cart.
- Sales End Soon
Provide time incentive promotions such as limited time sales. The sense of urgency can help trigger a sale, especially with impulse buying or instant gratification type of products. - Don’t Forget About Us
Implement remarketing campaigns that can target customers who have left products in their cart. This marketing effort displays ads on external sites that can help remind the customer of your ecommerce brand and their unfinished shopping experience on your site.
5. Check-Out Abandonment
The lower your check-out abandonment the better.
If leaving a cart full of items in the middle of an aisle in your store is annoying, leaving that same cart after entering your checkout lines is worse. Here too, there can be a lot of reasons why this happens but it can take a bit more digging to find out why. If you are running a simple or single item purchase ecommerce site you may be doing something like skipping the cart and going right to checkout. This will artificially inflate this number as it effectively is cutting off the add to cart action and putting everything on the line of check-out abandonment. You can find this information in the Shopping Behavior section of Google Analytics, just like add to cart and cart abandonment, Conversions > Ecommerce > Shopping Behavior.
Issues that can impact your check-out abandonment:
- User Experience
A confusing or complex checkout process can negatively impact your check-out experience and thus your check-out abandonment rate. Try to keep your check-out process clean and easy to use.
- Payment Options
This goes along with an easy to use check-out page, but making sure you offer consistent and quick ways of payment will lower your check-out abandonment. You don’t have to, nor should you offer every means of payment, but making sure to have at least a couple methods of payment ( on-site credit card and PayPal ) at the minimum is a great place to start. If you offer more methods like Google Wallet, Dwolla, Square etc… then make sure you make selecting from these options easy-to-identify and intuitive. - Shipping Costs
High or complex shipping costs can add confusion and frustration at the most critical part of the ecommerce shopping experience. Leveraging free shipping promotions and offering clearly described and reasonably priced shipping options will make it easier for your customers to choose from and decrease your check-out abandonment.
6. Bonus Key Performance Indicator – Ad Spend Vs. Revenue
The lower your ad spend in comparison to your revenue the better… sort of…
This can actually be a bit confusing for some as it depends on how you look at it. To see what I mean let’s examine a couple of scenarios, where the numbers are kept low for illustration purposes.
- Ad Spend: 0 / Revenue: $1000
Let’s be real, the ideal situation is for you to spend nothing and make money. But this doesn’t really tell a complete story. You could be leaving money on the table by limiting your sale opportunities overall. - Ad Spend: $100 / Revenue: $1100
In this scenario you are spending the same amount of money in ads that you are adding to your revenue. So on the surface this is a net 0 ROI, was it worth it? In short, yes as that $100 resulted in not just sales but also increased impressions and click throughs on searches. Click throughs and impressions will result in higher sales over time as it helps to build brand awareness and sales through direct traffic in the future. - Ad Spend: $500 / Revenue: $1750
Hey look at that, spending $400 more in ad spend resulted in an added $650 in sales. That means a net added revenue of $250 and that is starting to trend in the right direction! - Ad Spend: $1200 / Revenue: $2500
Ok, so we are starting to look at bigger numbers now and it appears that we are making progress, but are we? We have added $1200 to our theoretical ad spend which resulted in an added $1500, or a net revenue of gain of $300. A gain of $300 is better than $250 right? I would argue “no, in this case $300 is not better than $250”.Wait… $300 isn’t better than $250? If you are looking at it from a straight revenue gain it is, but if you are looking at the percentage of ad spend compared to overall revenue it isn’t. $500 is roughly 28% of your overall $1750 revenue, while $1200 is 48% of your $2500 in revenue. So, to me the added $50 in comparative revenue may not be worth it and I would recommend to reduce ad spend and focus that optimization of your ads and user experience which will result in increased comparative revenue and sales growth.
Looking for Ecommerce Performance Help?
Contact Fuzzy Duck to see how we can help you understand and grow your ecommerce business. We help businesses of all shapes and sizes to maximize their marketing dollars in SEO and PPC.